How to optimize your code
Disclaimer 1: This post was influenced heavily by my good friend, co-worker, and Haskell hacker Evan.
Disclaimer 2: Unless otherwise noted, I am completely making up terms in this article. I pulled them right out of the ether. Don’t expect to find industry conventions that agree with me.
Bob is a fictitious developer on my software team, who suggested that we could speed up some of our Qt/C++ code. The code under scrutiny is this:
for(int i=0; i<somelist .count(); i++)
{
SomeClass *ptr = someList[i];
// Do something with "ptr" here
}
[/cpp]
Bob suggested that we do this instead:
[cpp]
SomeClass *ptr;
for(int i=0; i<someList.count(); i++)
{
ptr = someList[i];
// Do something with "ptr" here
}
[/cpp]
Notice how we moved the <strong>ptr declaration outside the loop? That way, Bob surmised, the program doesn't allocate memory for <strong>ptr</strong> once per iteration of the loop. That should speed things up, right? Right?
This is an example of what I call <strong>Intuition-based Optimization</strong>, or <strong>IBO</strong> for short. IBO is a method of speeding up your code where the only tool you use is the raw power of your brain. It's where you apply human intuition to optimize your code, and no other tools, like profilers or measurements of any kind.
When you use IBO to speed up your code (or <strong>attempt</strong> to speed up your code), you should always remember the first and only rule of IBO:
<h2>st[i];
// Do something with "ptr" here
}
Bob suggested that we do this instead:
SomeClass *ptr;
for(int i=0; i
This is an example of what I call Intuition-based Optimization, or IBO for short. IBO is a method of speeding up your code where the only tool you use is the raw power of your brain. It’s where you apply human intuition to optimize your code, and no other tools, like profilers or measurements of any kind.
When you use IBO to speed up your code (or attempt to speed up your code), you should always remember the first and only rule of IBO:
The First and Only Rule of IBO: You are wrong.
There’s only one rule. You are wrong. If your computer program has a performance problem, and all you’ve done is think about what might be causing it and try to fix it, even if you use the almighty power of your human brain, which in its own right is a pretty advanced computer, you are wrong. You just are. Even if you aren’t wrong (hint: you are wrong), and the only tool you use for optimizing your code is IBO, then you don’t have a way to measure the effect of your code changes on your program’s actual speed.
All but the most obvious performance problems require tools to measure the effect of your code changes, and the most heinous problems require tools to identify where the bottle-necks are even happening.
I’ve lost track of the number of times I’ve used IBO to try to speed up some code, and failed. For example, it should be faster to use a hash-based lookup, like QHash, instead of a BST-based lookup, like QMap, in theory. In practice, though, there are other considerations. How many elements are in your data structure? How fast are the elements%2The First and Only Rule of IBO: You are wrong.
There’s only one rule. You are wrong. If your computer program has a performance problem, and all you’ve done is think about what might be causing it and try to fix it, even if you use the almighty power of your human brain, which in its own right is a pretty advanced computer, you are wrong. You just are. Even if you aren’t wrong (hint: you are wrong), and the only tool you use for optimizing your code is IBO, then you don’t have a way to measure the effect of your code changes on your program’s actual speed.
All but the most obvious performance problems require tools to measure the effect of your code changes, and the most heinous problems require tools to identify where the bottle-necks are even happening.
I’ve lost track of the number of times I’ve used IBO to try to speed up some code, and failed. For example, it should be faster to use a hash-based lookup, like QHash, instead of a BST-based lookup, like QMap, in theory. In practice, though, there are other considerations. How many elements are in your data structure? How fast are the elements’ hash-code functions vs. their comparison operators? Just because an algorithm is O(1) doesn’t mean it’s faster than an O(n) algorithm. There are just too many other variables besides order of complexity (not to mention, big “O” notation really only applies to theoretically very large datasets anyway).
So, if Intuition-based Optimization is so crappy at actually making code faster, then what is the right way?
Evidence-based Optimization
Or EBO, for short. This is where you use actual evidence to diagnose performance problems and measure the speed impact of your code changes. There are several techniques for doing this. Let’s look at a few.
Technique 1: The time command
In the simplest of situations, all you want to know is how long it takes your (command line) program to run. If you’re using a Unix-ish operating system like Linux or Mac OS X, you can use the time command to do this. Here’s an example:
$ time some-program

real    0m2.235s
user    0m0.155s
sys     0m0.077 hash-code functions vs. their comparison operators? Just because an algorithm is O(1) doesn't mean it's faster than an O(n) algorithm. There are just too many other variables besides order of complexity (not to mention, big "O" notation really only applies to theoretically very large datasets anyway).

So, if Intuition-based Optimization is so crappy at actually making code faster, then what is the right way?

<h2>Evidence-based Optimization</h2>

Or <b>EBO</b>, for short. This is where you use actual <b>evidence</b> to diagnose performance problems and measure the speed impact of your code changes. There are several techniques for doing this. Let's look at a few.

<h3>Technique 1: The time command</h3>

In the simplest of situations, all you want to know is how long it takes your (command line) program to run. If you're using a Unix-ish operating system like Linux or Mac OS X, you can use the <b>time</b> command to do this. Here's an example:

[bash]
$ time some-program

real    0m2.235s
user    0m0.155s
sys     0m0.075s
In a nutshell, the time command will tell you how long your program took to run. Look at the “real” time to get this info. The other two times listed tell you a little about where your program spent its time, and you can read a lot of cryptic details about these numbers from the time man page. For most simple applications, the “real” time is adequate.
Technique 2: Measuring time in your program
A more common case is that a subset of your application is running slowly, but you don’t know exactly where. Maybe you have an educated guess where the code is getting bogged down, but you want to use actual evidence to identify the code that is causing the problem (congratulations on wanting to use evidence instead of intuition by the way).
If you’re using Qt and C++ (which by the way is the only non-insane way to write C++ code), you can use the QTime class to do this. If you are using version 4.7 or newer5s
[/bash]
In a nutshell, the time command will tell you how long your program took to run. Look at the “real” time to get this info. The other two times listed tell you a little about where your program spent its time, and you can read a lot of cryptic details about these numbers from the time man page. For most simple applications, the “real” time is adequate.
Technique 2: Measuring time in your program
A more common case is that a subset of your application is running slowly, but you don’t know exactly where. Maybe you have an educated guess where the code is getting bogged down, but you want to use actual evidence to identify the code that is causing the problem (congratulations on wanting to use evidence instead of intuition by the way).
If you’re using Qt and C++ (which by the way is the only non-insane way to write C++ code), you can use the QTime class to do this. If you are using version 4.7 or newer, you can use the QElapsedTimer class for a little bit more precision, but I have not needed that much more precision.
Here’s how you use QTime:
QTime time;
time.start()
// Code to measure goes here
qDebug() < < "Took:" << time.elapsed() << "ms"; [/cpp] It's fairly simple. There are caveats to be aware of, though. If you are measuring code that executes in less than a few milliseconds, QTime will not give meaningful results. There are a few ways to work around this problem. You can simply increase the number of iterations, using a naive approach like this: [cpp] QTime time; time.start() for(int i=0; i<10000; i++) { // Code to measure goes here } qDebug() << "Took:" << ((float)time.elapsed() / 10000) << "ms per iteration"; [/cpp] You can also get more clever about where to put your calls to QTime::start()., you can use the QElapsedTimer class for a little bit more precision, but I have not needed that much more precision.
Here’s how you use QTime:
QTime time;
time.start()
// Code to measure goes here
qDebug() < < "Took:" << time.elapsed() << "ms"; [/cpp] It's fairly simple. There are caveats to be aware of, though. If you are measuring code that executes in less than a few milliseconds, QTime will not give meaningful results. There are a few ways to work around this problem. You can simply increase the number of iterations, using a naive approach like this: [cpp] QTime time; time.start() for(int i=0; i<10000; i++) { // Code to measure goes here } qDebug() << "Took:" << ((float)time.elapsed() / 10000) << "ms per iteration"; [/cpp] You can also get more clever about where to put your calls to QTime::start(). You can use a QTime instance as a member variable and start it whenever it makes sense to begin measuring (perhaps as the result of a user action, like a button click). This can be handy when there are multiple threads involved to measure the sum total execution time. Let's use this technique to measure Fictitious Bob's opening example from above. Which of these two approaches is faster? Exhibit A:
for(int i=0; i
SomeClass *ptr;
for(int i=0; i
Let’s use this technique to measure Fictitious Bob’s opening example from above.
Which of these two approaches is faster?
Exhibit A:
for(int i=0; i
SomeClass *ptr;
for(int i=0; i
QTime time;
time.start();
for(int i=0; i
They’re the same speed
Those of you who are assembly heads would have guessed this already, and the rest of us will probably come to a rational explanation aftere tells me. Here’s how you measure that using QTime:
QTime time;
time.start();
for(int i=0; i
They’re the same speed
Those of you who are assembly heads would have guessed this already, and the rest of us will probably come to a rational explanation after seeing the results. Evidence-based Optimization has that effect on you: You’ll take a wild guess about the cause of the slowness, and then after you gather some evidence, you refine (or completely discard!) that guess to match the measurements.
Technique 3: Unit Tests
There are times when you create some code that is particularly sensitive to performance changes. Perhaps it’s a piece of code that gets used in a lot of time-sensitive areas of your application, and you want it to be fast, and you want to make sure it stays fast for the life of the project. This is where unit testing is your friend. In the case of Qt, the Trolls have provided us with QBENCHMARK.
QBENCHMARK allows you to write a unit test that reliably measures the execution speed of a code snippet by running it multiple times as needed. It produces nice output that you can capture for posterity. Months later, you can double check that your code is still running as fast as you originally measured by re-running the unit test. I’ve used this technique on a few rare occasions seeing the results. Evidence-based Optimization has that effect on you: You’ll take a wild guess about the cause of the slowness, and then after you gather some evidence, you refine (or completely discard!) that guess to match the measurements.
Technique 3: Unit Tests
There are times when you create some code that is particularly sensitive to performance changes. Perhaps it’s a piece of code that gets used in a lot of time-sensitive areas of your application, and you want it to be fast, and you want to make sure it stays fast for the life of the project. This is where unit testing is your friend. In the case of Qt, the Trolls have provided us with QBENCHMARK.
QBENCHMARK allows you to write a unit test that reliably measures the execution speed of a code snippet by running it multiple times as needed. It produces nice output that you can capture for posterity. Months later, you can double check that your code is still running as fast as you originally measured by re-running the unit test. I’ve used this technique on a few rare occasions and have been happy to have it.
Technique 4: Web Techniques
Sometimes an application’s slowness seems like it’s out of the developer’s hands to influence. Take for instance a web application where there are many pieces of software interacting. You may have a database, a web server, a browser, and other stuff, all vying for CPU time. In these cases, it makes sense to use tools that are able to observe the application state from an outside source, like Yahoo’s YSlow Firebug add-on.
In this case, YSlow will tell you which parts of your web display are taking the longest to appear on the user’s web browser, which sometimes can tell you a great deal about where your code needs to be optimized.
Technique 5: Profilers
Profilers are a special animal and require careful usage to produce useful results. Almost all of my profiler experience comes from Valgrind on Linux. Running your application under Valgrind produces a log file that lists every function call and how long was spent iand have been happy to have it.
Technique 4: Web Techniques
Sometimes an application’s slowness seems like it’s out of the developer’s hands to influence. Take for instance a web application where there are many pieces of software interacting. You may have a database, a web server, a browser, and other stuff, all vying for CPU time. In these cases, it makes sense to use tools that are able to observe the application state from an outside source, like Yahoo’s YSlow Firebug add-on.
In this case, YSlow will tell you which parts of your web display are taking the longest to appear on the user’s web browser, which sometimes can tell you a great deal about where your code needs to be optimized.
Technique 5: Profilers
Profilers are a special animal and require careful usage to produce useful results. Almost all of my profiler experience comes from Valgrind on Linux. Running your application under Valgrind produces a log file that lists every function call and how long was spent in each. This can be both useful and overwhelming in sheer quantity of information.
Of course, Valgrind is a very complicated tool, but here are some simple usage examples to get you started.
To profile your application fully, use the callgrind tool like so:
valgrind --tool=callgrind /path/to/your/application
That produces a file (sometimes multiple files) called something like callgrind.out. Don’t try to read that file with an editor. Instead, use an application called KCacheGrind, like so:
kcachegrind callgrind.out
You’ll see something like this:
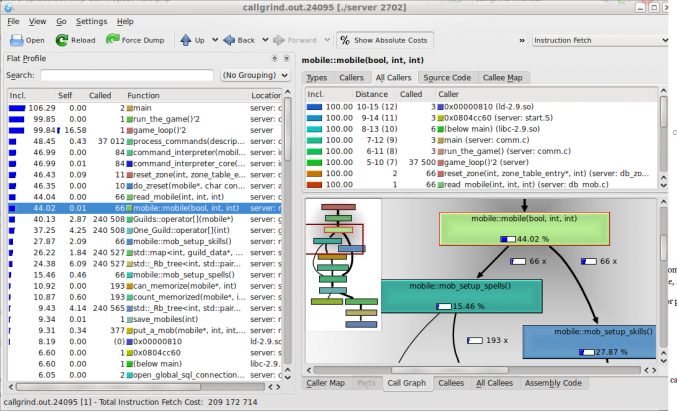
There’s no easy path at this point. You’ll have to look at the flood of results and carefully try to learn where your application is spending its time. Notice that KCacheGrind will show you how much time is spent in each function and how much time is spent in “callee” functions, which lets you determine wheren each. This can be both useful and overwhelming in sheer quantity of information.
Of course, Valgrind is a very complicated tool, but here are some simple usage examples to get you started.
To profile your application fully, use the callgrind tool like so:
valgrind --tool=callgrind /path/to/your/application
That produces a file (sometimes multiple files) called something like callgrind.out. Don’t try to read that file with an editor. Instead, use an application called KCacheGrind, like so:
kcachegrind callgrind.out
You’ll see something like this:
There’s no easy path at this point. You’ll have to look at the flood of results and carefully try to learn where your application is spending its time. Notice that KCacheGrind will show you how much time is spent in each function and how much time is spent in “callee” functions, which lets you determine where the heavy lifting is actually happening.
I often like to use the callee graph on the right-hand side to see, by geometry, which functions are the most used. This often tells you which standard library or Qt core classes are being used the most, which can provide a hint as to which of your own code is the culprit
Technique 6: Stochastic Profiling
Disclaimer: I did not invent this term. I heard it first from my brilliant co-worker, Shane, who I believe borrowed it from another discipline.
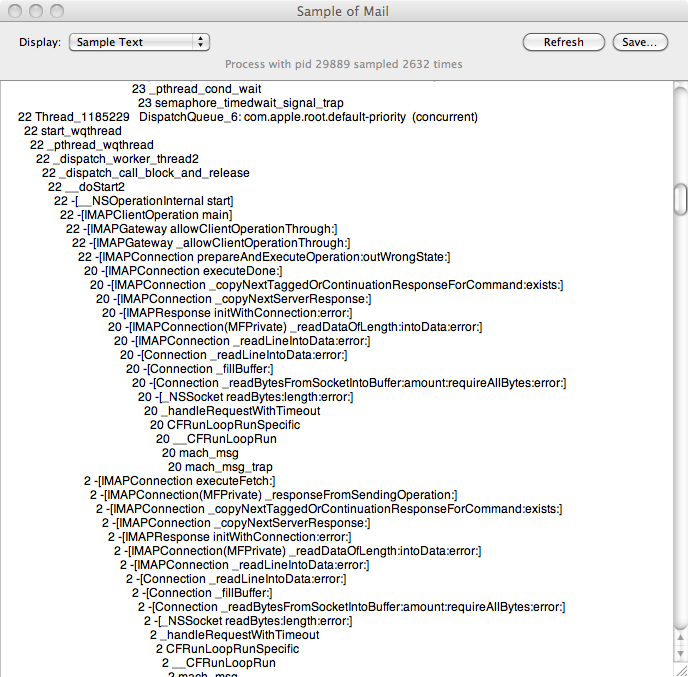
Sometimes an application will go into a CPU hogging run-away state and it’s impossible to tell where in the code this is happening. If it lasts for more than a moment, you can use a technique called stochastic profiling to sample the program’s state to get a snapshot of the current function call tree.
There are several techniques for doing this.
On Mac OS X, you can use the Activity Monitor’s “Sample Process” button, and see a nice call graph, shown below for the Mail application:
On Linux, the heavy lifting is actually happening.
I often like to use the callee graph on the right-hand side to see, by geometry, which functions are the most used. This often tells you which standard library or Qt core classes are being used the most, which can provide a hint as to which of your own code is the culprit
Technique 6: Stochastic Profiling
Disclaimer: I did not invent this term. I heard it first from my brilliant co-worker, Shane, who I believe borrowed it from another discipline.
Sometimes an application will go into a CPU hogging run-away state and it’s impossible to tell where in the code this is happening. If it lasts for more than a moment, you can use a technique called stochastic profiling to sample the program’s state to get a snapshot of the current function call tree.
There are several techniques for doing this.
On Mac OS X, you can use the Activity Monitor’s “Sample Process” button, and see a nice call graph, shown below for the Mail application:
On Linux, you can achieve the same thing using gdb to attach to a process by pid (make sure you have the right permissions), and run the bt command to see where it’s currently executing.
If you do this a few times, you can start to get a feel for where the program is spending its time.
Conclusion
There you have it. Remember that when it comes to optimizing your code for speed, don’t believe your intuition, and learn to use tools to measure your code. Remember to measure, modify, and re-measure.
Happy optimizing!
4 comments to “How to optimize your code”
tl;dr
Some day I hope to understand this stuff.
It really intrigues me and I want to learn, but have *no* idea where to begin.
You’re an inspiration Dave!
“They’re the same speed.
Those of you who are assembly heads would have guessed this already, and the rest of us will probably come to a rational explanation after seeing the results.”
The space for ptr is allocated once on the stack, at the start of the loop (or more likely, for a smart compiler, at the start of the function) and simply reused. Almost certainly, the two code blocks will generate exactly the same code.
A basic understanding of how objects and pointers are stored in memory is *essential* not just for optimizing code, but even just for *using* C++. For example, without this understanding, it is completely non-obvious why ‘return &instanceVariable;’ is fine, but ‘return &ptr;’ (for the ptr defined above) would result in undefined behaviour!
Also, note that if ptr were of type SomeClass, rather than type SomeClass*, things would be very different. Suddenly example B is calling operator=() once every iteration, while example A is calling TWO methods every iteration: a copy-constructor, and a destructor. In this case, you will likely see a small speed difference, which depends on how those methods were implemented.
+1 what BlueRaja wrote.
Of course moving a ptr declaration+assignment outside a loop does not speed anything up. Its the same asm code. The only optimization possible in this example is moving the loops end condition outside the loop
for (int i,len=list.size();i<len;++i)
but this is also something any current compiler should optimize itself (in release builds).